Monitoring Applications
This tutorial will guide you through the steps required to deploy an application on APPUiO Cloud, set up some alerts, and trigger those alerts through Pushover. We will also deploy Grafana and display some metrics from our application.
About the Application
We will use the Fortune in Go application, freely available on GitLab. This application exposes Prometheus-compatible metrics off the box and defines a custom metric called "fortune_generated_message," keeping count of the number of fortune messages generated. We will use this metric later in this tutorial.
var (
	fortuneGenerated = promauto.NewCounter(prometheus.CounterOpts{
		Name: "fortune_generated_message",
		Help: "The total number of generated messages",
	}) (1)
)

// …

func fortune() string {
	fortuneGenerated.Inc() (2)
	cmd := exec.Command("fortune")

	cmd.Stdin = strings.NewReader("")

	var out bytes.Buffer
	cmd.Stdout = &out

	err := cmd.Run()

	if err != nil {
		log.Fatal(err)
	}

	return out.String()
}| 1 | This definition specifies a Prometheus counter named fortune_generated_message |
| 2 | We increment the Prometheus counter at each execution of this function. |
Configuration
For this tutorial, we will need an account at Pushover.
-
Open a free account at Pushover, or login into your existing account if you have one; copy your "user key" shown on the user interface.
-
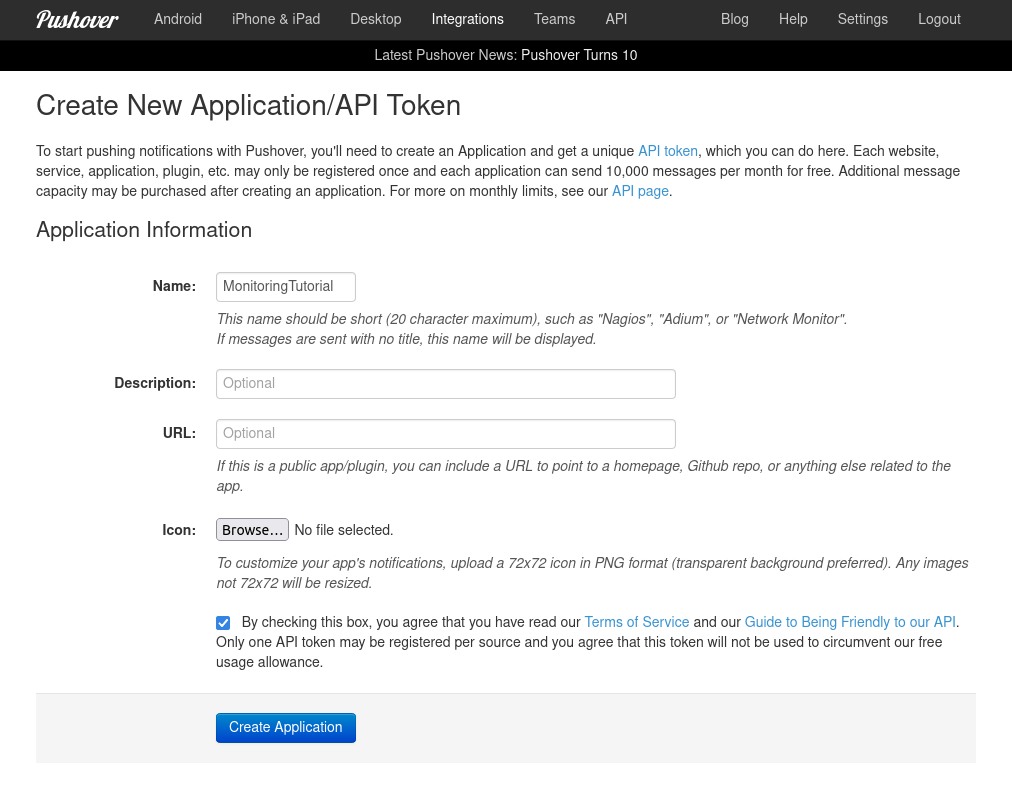
Create a new application in the Pushover interface and copy the provided API key.
-
Download and configure the Pushover mobile app, or open the Pushover web client to receive notifications on your browser.
-
Clone the "Monitoring in APPUiO Cloud" demo project on GitLab.
-
Copy the file
variables.exampleand rename itvariables. -
Change the values in the file
variablesto contain the following items:-
The APPUiO Cloud region where you’ll be working.
-
The name of the projects where you’ll deploy the Fortune application and Grafana.
-
The Pushover user key and API keys, as shown on the Pushover user interface.
APPUIO_CLOUD_ZONE=cloudscale-lpg-2 (1)
APP_PROJECT=xxxxx-fortune
GRAFANA_PROJECT=xxxxx-grafana
PUSHOVER_USER_KEY=xxxxxxxxxxxxxxxxxxxxxxxxxxxxxx
PUSHOVER_API_KEY=xxxxxxxxxxxxxxxxxxxxxxxxxxxxxx
1 You can use other APPUiO Cloud Zones too. See portal.appuio.cloud/zones for a list of alternatives.
-
Deploy the Fortune in Go Application
The first step is to deploy the Fortune in Go application on its APPUiO Cloud project. To make this happen, we require three familiar objects: a Deployment, a Service, and an Ingress object. The Deployment specifies the container to use: registry.gitlab.com/vshn/applications/fortune-go:latest.
-
Execute the following commands:
source variables oc new-project $APP_PROJECT oc process -f 1_deployment.yaml --param-file=variables | oc apply -f - -
After a few seconds, you should be able to open the corresponding route and interact with the application.
-
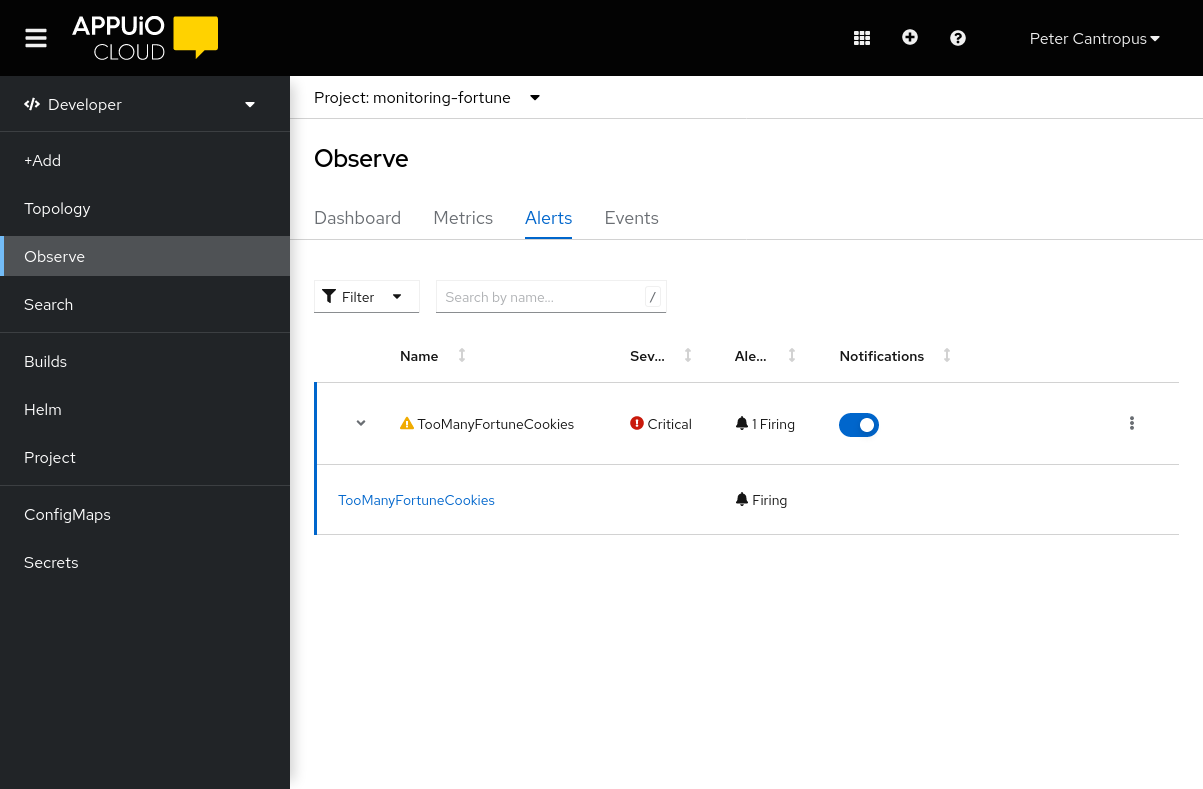
On the APPUiO Cloud console, select the "Developer" perspective, click on the "Observe" menu on the left, and then select the "Alerts" tab. This screen will display the alerts we will generate in the following step.
Generate and Receive Alerts
After deploying the application, we will configure AlertManager and Prometheus to consume the usage information reported by the application. Doing so requires the following objects:
-
A
ServiceMonitorobject; -
A
PrometheusRuleobject specifying the expression to be used as a rule to determine whether an alert should be raised. In our case, we will be using this rule:rate(fortune_generated_message[1m]) > 5 -
And an
AlertmanagerConfigobject. This last object requires two Secret objects, specifying Pushover’s "user key" and "API key."
AlertmanagerConfig objects can be configured with a variety of services such as Telegram, Slack, and others. The AlertManager configuration page provides more information.
|
Follow these steps:
-
Execute the following command:
oc process -f 2_alerts.yaml --param-file=variables | oc apply -f - -
Open the Fortune in Go application on your browser.
-
Press the R key for about 20 or 30 seconds while using the Fortune in Go application; your mobile or web Pushover clients should receive a notification in a minute or two.
-
During the interaction with the application, the Alert screen on the APPUiO Cloud console will display a message indicating that the alert has been triggered.
-
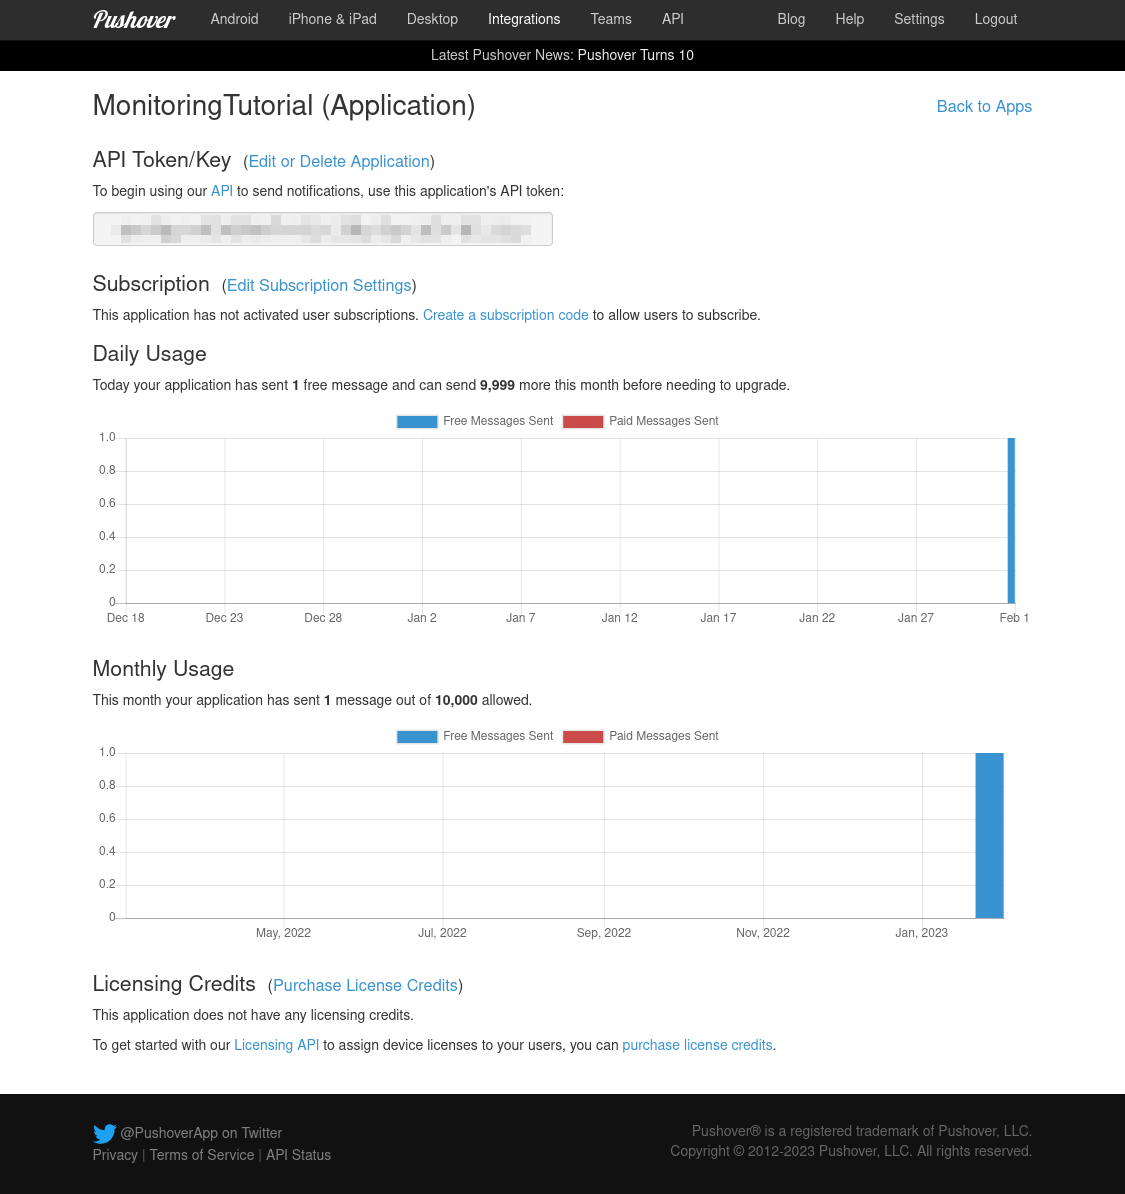
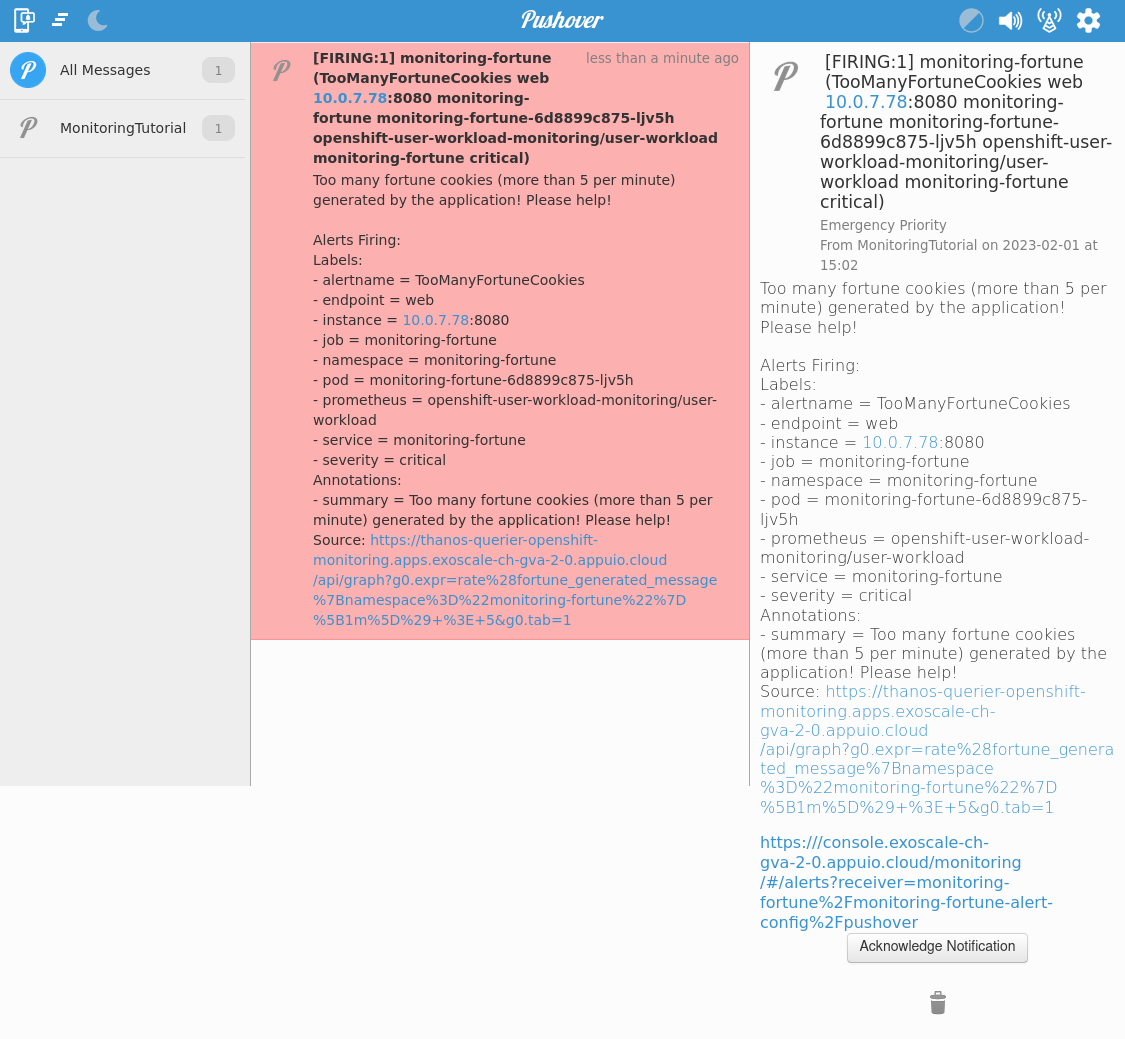
The Pushover interface should show that an alert arrived, and the Pushover client should show the notification, including the error message specified in the YAML file.
| In case of trouble, please check the Troubleshooting section of the "Configure Alert Receivers" page. |
Deploy Grafana
The final step consists of deploying and connecting a custom Grafana instance to the Fortune in Go application. Deploying Grafana, once again, requires a Deployment, a Service, and an Ingress object.
-
Execute the following commands:
oc new-project $GRAFANA_PROJECT oc process -f 3_grafana.yaml --param-file=variables | oc apply -f - -
After a minute or two, open the route generated by the manifest on your browser; you should see the Grafana login screen.
-
Use the
adminuser andadminpassword to log in. -
Skip the screen asking you to change your password.
-
-
Create a new data source by clicking on the "Add your first data source" button.
-
Select "Prometheus" (first entry on the list)
-
Follow the instructions to configure Prometheus as a data source.
-
-
Get the values of the token and certificates from the deployment.
# Your Certificat Authority (CA) oc get secret $GRAFANA_PROJECT-viewer -ojsonpath={.data."service-ca\.crt"} | base64 -d # Your Bearer HTTP access token echo "Bearer $(oc get secret $GRAFANA_PROJECT-viewer -ojsonpath={.data.token} | base64 -d)" -
Create a new dashboard.
-
Open the "Dashboards" menu at the left and select the "+ Import" entry.
-
Select the file
4_dashboard.json. Specify the "Prometheus" data source defined in the previous step.
-
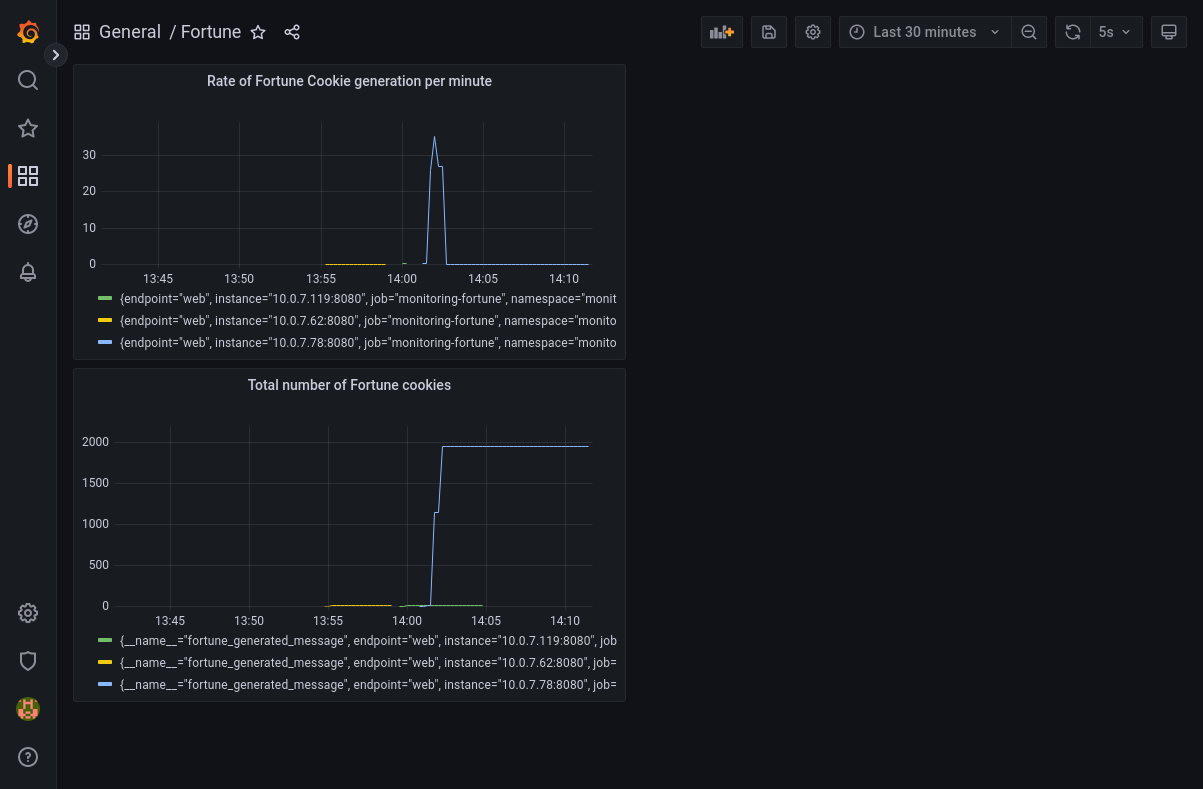
-
Your Grafana dashboard should look like the one in the following image.