Use Custom Grafana
This page describes how to access the metrics of your projects in a custom Grafana instance.
It doesn’t describe how to set up and configure Grafana itself, but assumes that you have a Grafana instance running on the same APPUiO Cloud Zone. You can follow the official documentation to set up and configure Grafana on APPUiO Cloud.
| Grafana needs to run on the same APPUiO Cloud Zone. The Zone’s metrics aren’t exposed outside the cluster. |
Create Service Account
Grafana will need a Kubernetes service account to be able to access metrics from APPUiO Cloud
-
Create service account for Grafana
GRAFANA_NAMESPACE="my-grafana" (1)

kubectl -n "${GRAFANA_NAMESPACE}" apply -f - <<YAML
---
apiVersion: v1
kind: ServiceAccount
metadata:
  name: grafana-viewer
---
apiVersion: v1
kind: Secret
type: kubernetes.io/service-account-token
metadata:
  name: grafana-viewer
  annotations:
    kubernetes.io/service-account.name: grafana-viewer
YAML
1 The namespace of the Grafana deployment. -
Extract token and certificate authority
TOKEN=$(kubectl -n "${GRAFANA_NAMESPACE}" get secret grafana-viewer -ojsonpath={.data.token} | base64 -d)
CA=$(kubectl -n "${GRAFANA_NAMESPACE}" get secret grafana-viewer -ojsonpath={.data."service-ca\.crt"} | base64 -d)
Add Data Source for Project
| You’ll need to add each project as a separate data source. Adding a single data source for multiple projects isn’t supported. |
-
Give the service account permission to access the metrics of the project. For that you need to grant the service account permission to view pods in the target namespace.
APP_NAMESPACE="my-app"(1)

kubectl -n "${APP_NAMESPACE}" create rolebinding grafana-viewer --clusterrole=appuio:metrics-reader --serviceaccount="${GRAFANA_NAMESPACE}:grafana-viewer"
1 The project you want to monitor. -
Add data source to Grafana.
Login to your Grafana instance and add a Prometheus data source by navigating to
Configuration>Data sources>Add data source>PrometheusSet the following configuration
HTTP
URL
https://thanos-querier.openshift-monitoring.svc:9092Auth
With Credentials
TrueWith CA Cert
TrueTLS/SSL Auth Details
CA Cert
$CACustom HTTP Headers
Header:
AuthorizationValue:
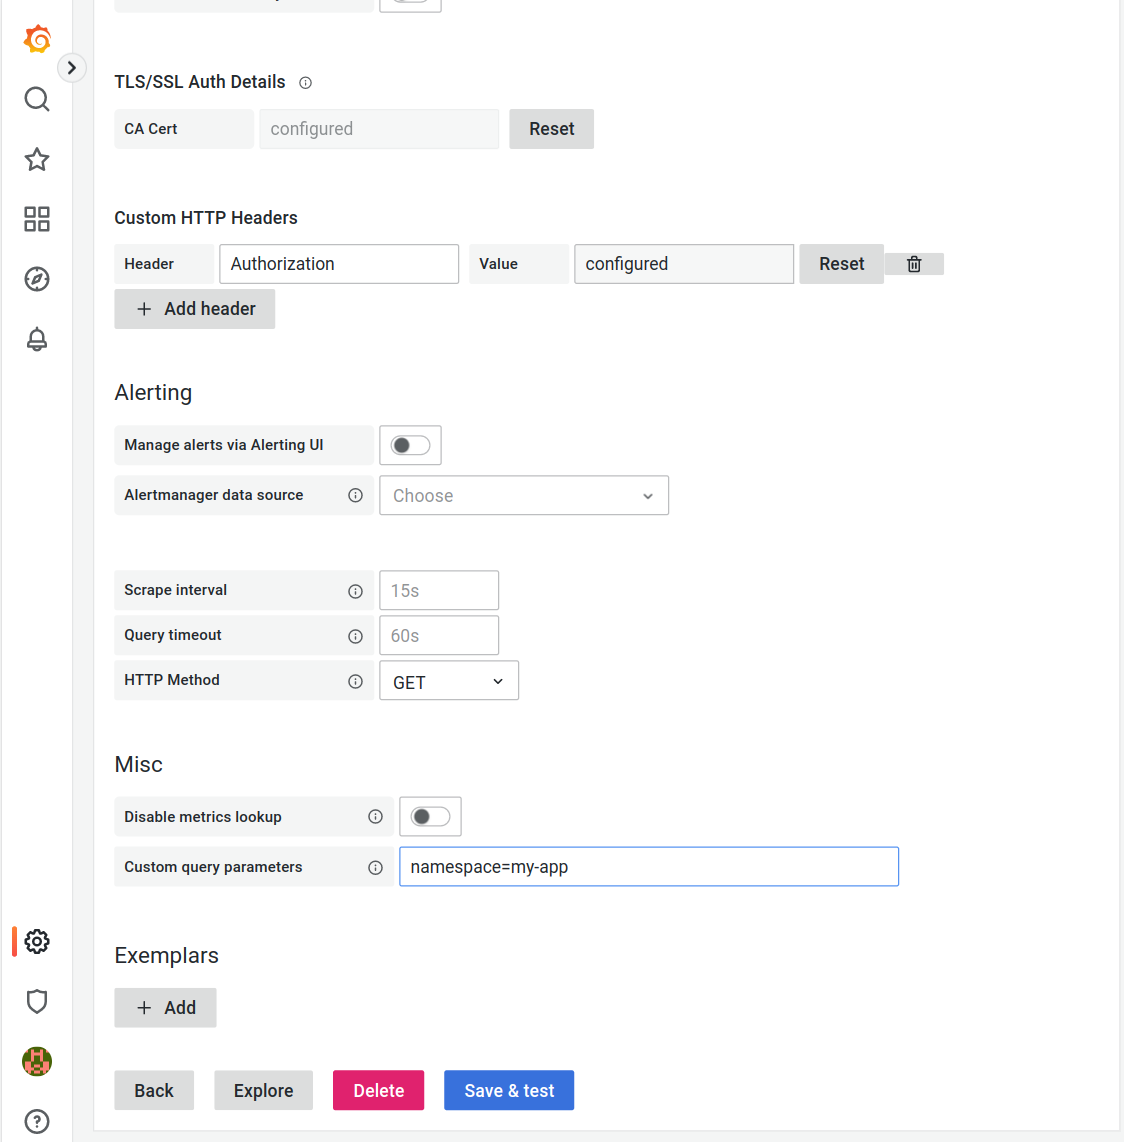
Bearer $TOKENAlerting
HTTP Method
GETMisc
Custom query parameters
namespace=${APP_NAMESPACE}Grafana defaults to the HTTP method
POST, however we found inconsistencies when using it to access metrics of a single project. We recommend to fall back toGET.You need to substitute
$CA,$TOKEN, and${APP_NAMESPACE}with the values of the environment variables set earlier. You can easily display their contents usingprintf "%s" "$CA".Note that using
echoto output variables might mangle line breaks and could lead to the configuration failing.Make sure to not use quotes for the custom query parameters. Using
namespace="my-app"will result in permission errors, usenamespace=my-app.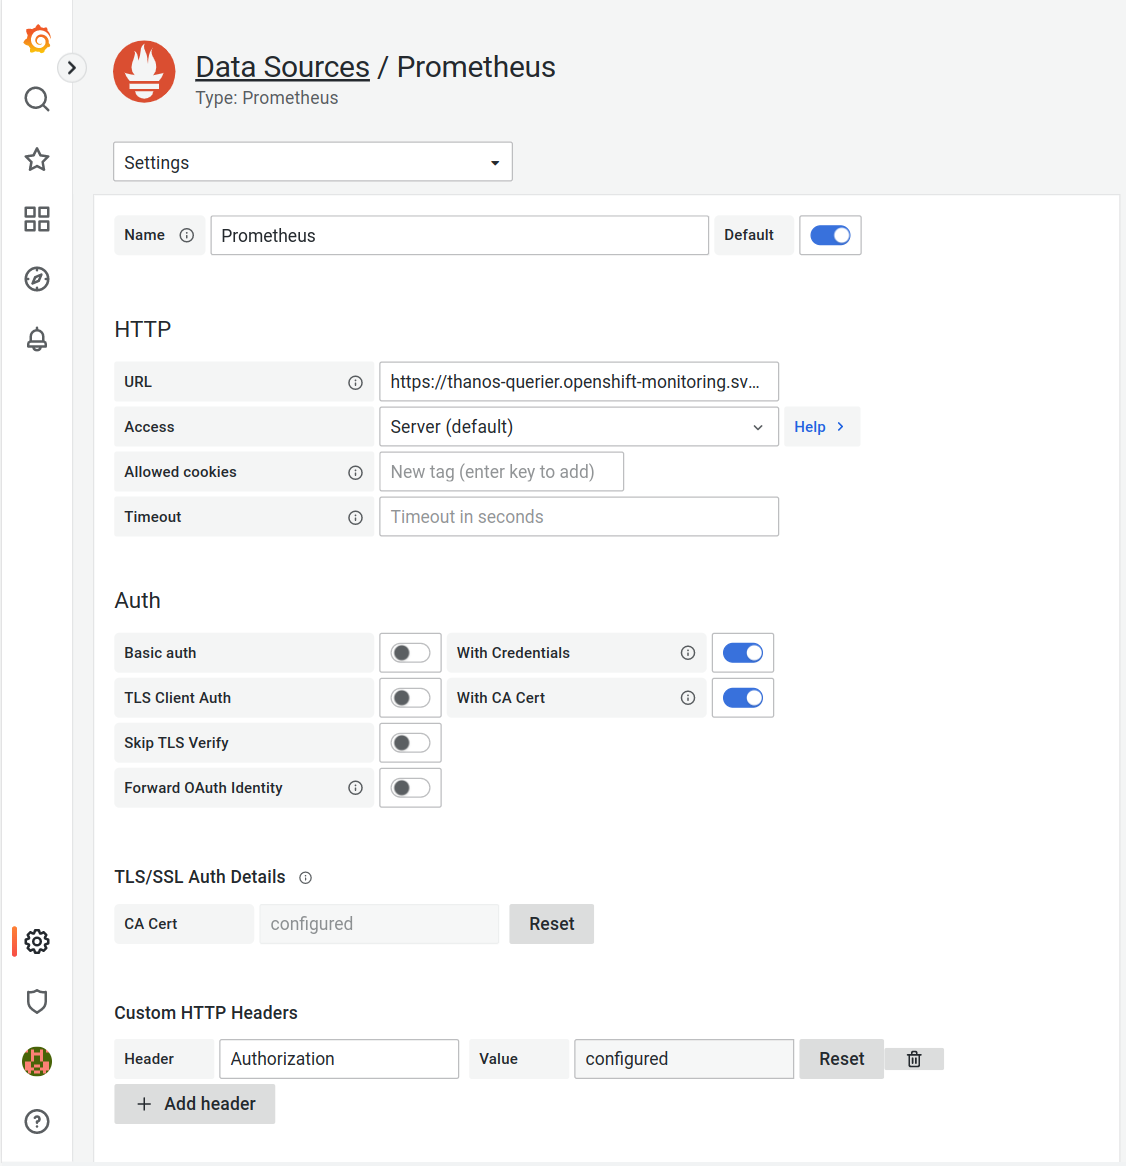
-
You should now be able to create dashboards using the metrics exported by the target project.