Monitor Application With Prometheus
This page explains how to collect and view Prometheus metrics exposed by a sample application on APPUiO Cloud and how to write alerts using them.
|
To get notified about firing alerts you need to setup an alert receiver. See Configure Alert Receivers for more information. |
Deploy a Sample Application
-
Create a new namespace for the sample application
ZONE="cloudscale-lpg-2"(1)
APP_NAMESPACE="monitoring-example" (2)
kubectl create namespace ${APP_NAMESPACE}
1 The APPUiO Cloud Zone to deploy to 2 The namespace for the application. Please choose a unique name. -
Check that the namespace was created successfully.
kubectl get namespace ${APP_NAMESPACE} -
Install the sample application
kubectl -n "${APP_NAMESPACE}" apply -f - <<YAML apiVersion: apps/v1 kind: Deployment metadata: labels: app: prometheus-example-app name: prometheus-example-app spec: replicas: 1 selector: matchLabels: app: prometheus-example-app template: metadata: labels: app: prometheus-example-app spec: containers: - image: ghcr.io/rhobs/prometheus-example-app:0.4.1 imagePullPolicy: IfNotPresent name: prometheus-example-app securityContext: allowPrivilegeEscalation: false capabilities: drop: ["ALL"] runAsNonRoot: true seccompProfile: type: "RuntimeDefault" --- apiVersion: v1 kind: Service metadata: labels: app: prometheus-example-app name: prometheus-example-app spec: ports: - port: 8080 protocol: TCP targetPort: 8080 name: web selector: app: prometheus-example-app type: ClusterIP --- apiVersion: networking.k8s.io/v1 kind: Ingress metadata: annotations: cert-manager.io/cluster-issuer: letsencrypt-production name: prometheus-example-app spec: rules: - host: ${APP_NAMESPACE}.apps.$ZONE.appuio.cloud http: paths: - pathType: Prefix path: / backend: service: name: prometheus-example-app port: number: 8080 tls: - hosts: - ${APP_NAMESPACE}.apps.$ZONE.appuio.cloud secretName: prometheus-example-app-tls YAML -
Check that the application is running
kubectl -n "${APP_NAMESPACE}" get pod -
Check that the route was created
kubectl -n "${APP_NAMESPACE}" get route -w -
After a few seconds, you should be able to access the sample deployment
curl https://$APP_NAMESPACE.apps.$ZONE.appuio.cloudYou should also be able to manually access the exported metrics
curl https://$APP_NAMESPACE.apps.$ZONE.appuio.cloud/metrics
Collect Metrics
-
Configure a service monitor
kubectl -n "${APP_NAMESPACE}" apply -f - <<YAML
apiVersion: monitoring.coreos.com/v1
kind: ServiceMonitor
metadata:
  labels:
    k8s-app: prometheus-example-monitor
  name: prometheus-example-monitor
spec:
  endpoints:
  - interval: 30s
    port: web (1)
    scheme: http
  selector:
    matchLabels:
      app: prometheus-example-app (2)
YAML
1 The port on which the application provides the metrics endpoint, defined in the Serviceresource2 A selector that points to the service of the application Consult the ServiceMonitor API for more configuration options. -
View the collected metrics
Navigate to the OpenShift Web Console console.CLUSTER.cloud/dev-monitoring/ns/<APP_NAMESPACE>/metrics.
Select Custom Query and enter
rate(http_requests_total[1m]). You should see a graph showing the request rate to the example application.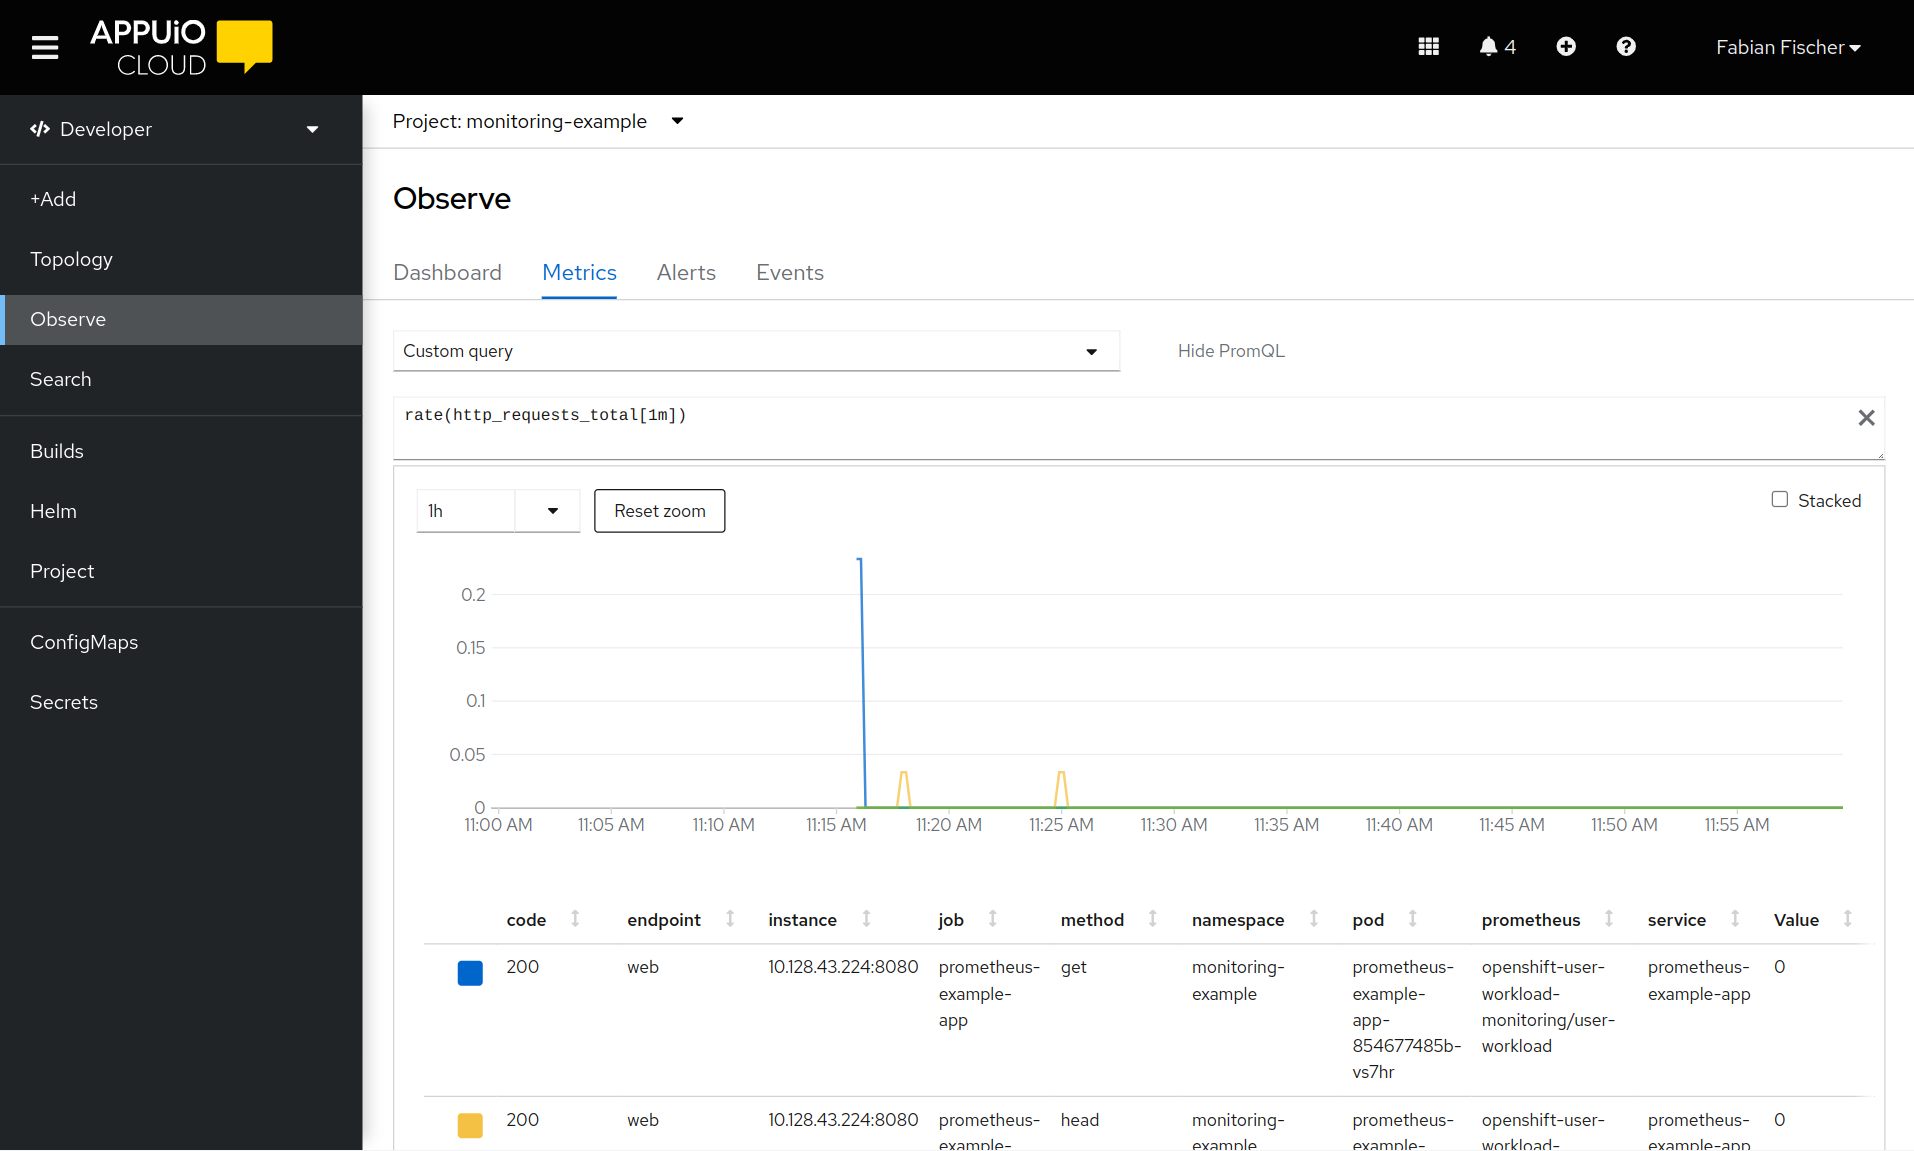
Create an Alert
-
Create the alert rule
kubectl -n "${APP_NAMESPACE}" apply -f - <<YAML
apiVersion: monitoring.coreos.com/v1
kind: PrometheusRule
metadata:
  name: prometheus-example-alert
spec:
  groups:
  - name: prometheus-example-alert
    rules:
    - alert: TooManyrequests
      expr: rate(http_requests_total[1m]) > 1 (1)
      labels:
        severity: info
      annotations:
        summary: "There are a lot of requests to the application"
YAML
1 The alert rule will fire if the application receives more than 60 requests in one minute. Look at the upstream documentation on writing your own alerting rules. -
Verify that the alert was picked up by Prometheus
Navigate to the OpenShift Web Console console.<CLUSTER>.cloud/dev-monitoring/ns/<APP_NAMESPACE>/alerts.
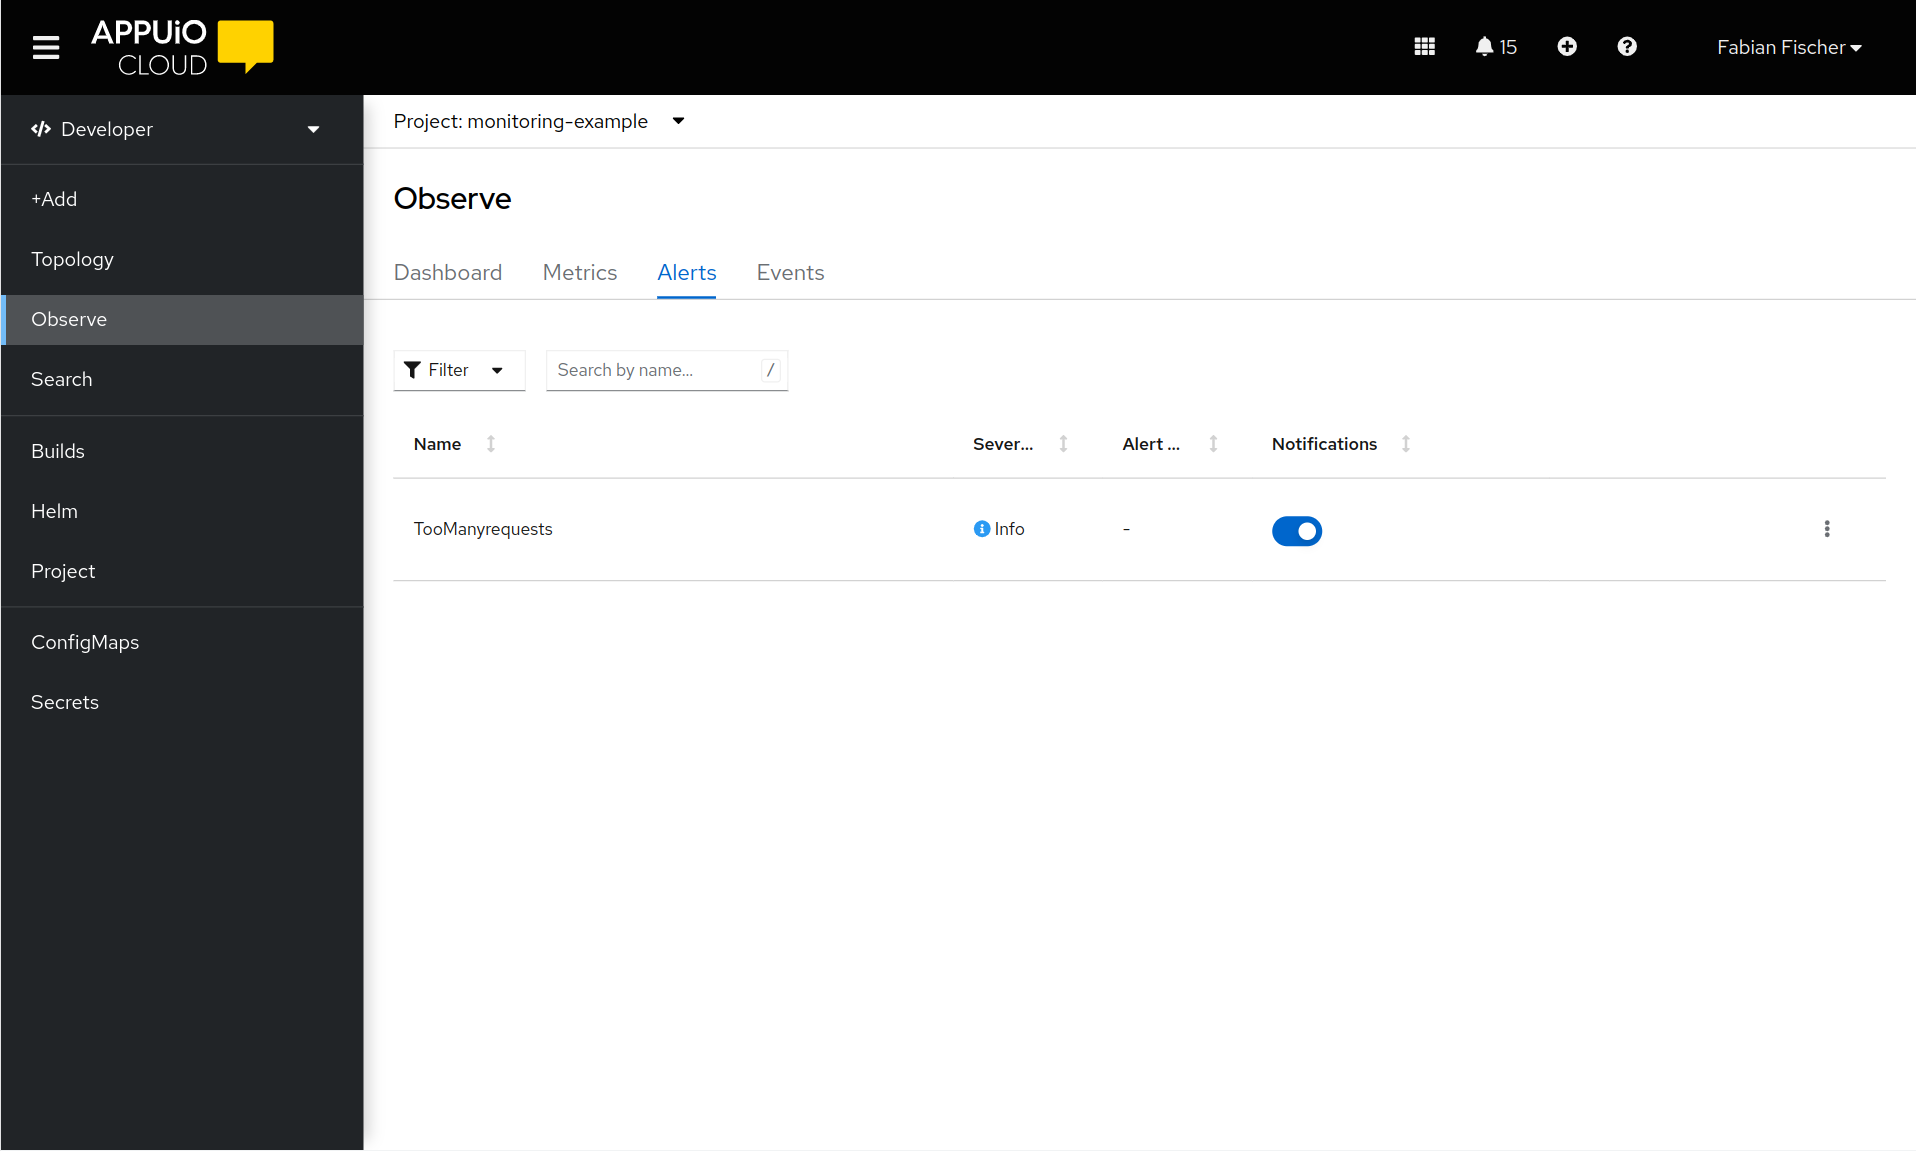
The alert should be displayed in the list of alerts.
It may take a few minutes for the alert to show up. If it doesn’t show up, that most likely means that the
PrometheusRuleCRD isn’t well-formed and might have failed to apply, or that the PromQL expression isn’t valid.Check if the
PrometheusRuleCRD was created successfully.kubectl -n "${APP_NAMESPACE}" get prometheusrulesIf this seems correct, check that the PromQL expression is valid by entering it in the UI.
-
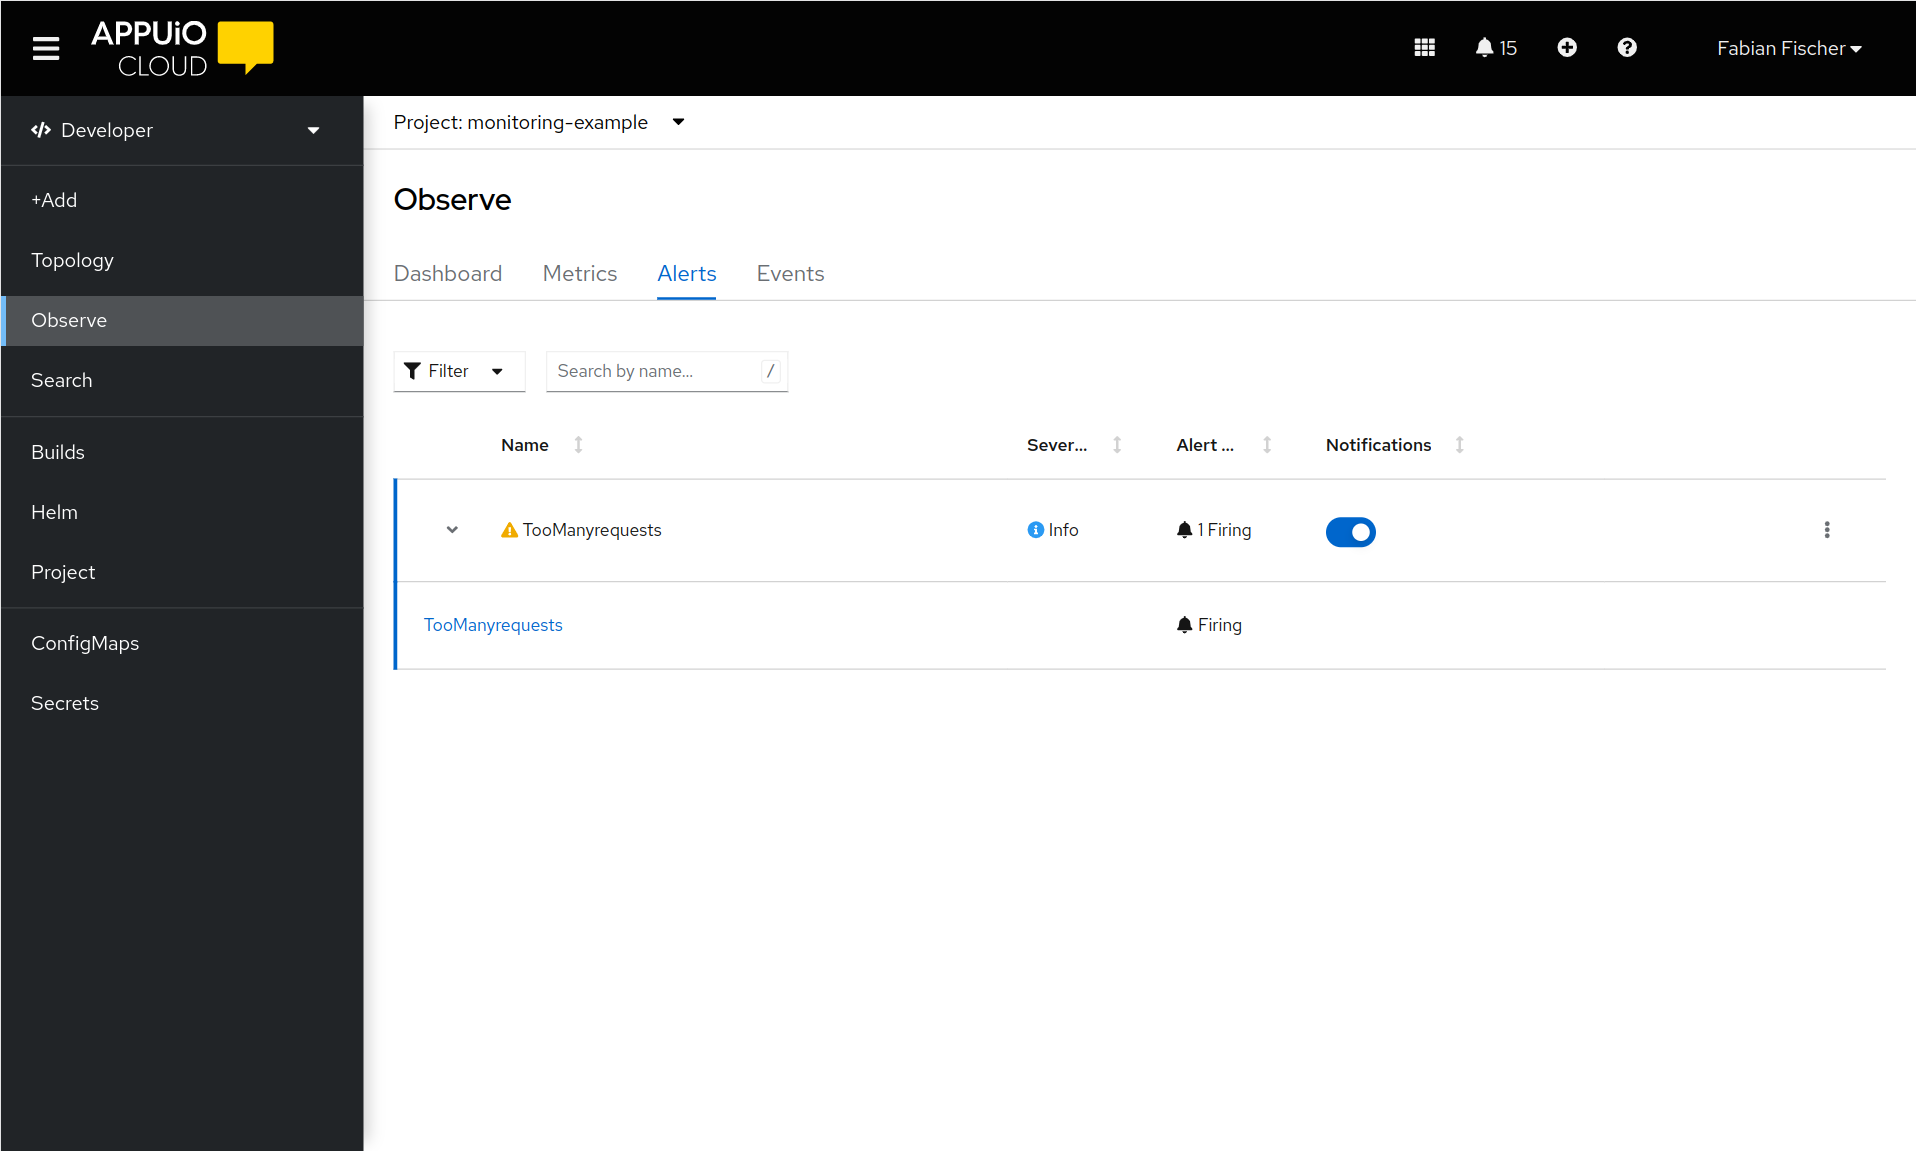
Check that the alert will fire by generating requests
for i in {1..70}
do
  curl https://$APP_NAMESPACE.apps.$ZONE.appuio.cloud
done
Navigate to the OpenShift Web Console console.<CLUSTER>.cloud/dev-monitoring/ns/<APP_NAMESPACE>/alerts.
The alert should now be firing.