Configure Alert Receivers
APPUiO Cloud allows you to configure custom alert receivers to notify you when an alert is triggered.
This how-to guide shows you alert receivers and routing basics with examples for Slack, Telegram, and email.
Configure Alertmanager
OpenShift uses Alertmanager to manage alerts and send notifications to the correct receiver.
Alertmanager brings different integrations which can be listed by running kubectl explain alertmanagerconfigs.spec.receivers.
The basic structure of the Alertmanager configuration is as follows. Click the links below to see a configuration example for each section:
apiVersion: monitoring.coreos.com/v1beta1
kind: AlertmanagerConfig
metadata:
  name: alert-config
spec:
  receivers:
  - name: telegram
    telegramConfigs: {} (1)
  - name: slack
    slackConfigs: {} (2)
  - name: email
    emailConfigs: {} (3)
  route: (4)
    receiver: default
routes: []| 1 | Configuration for Telegram. See Configure Telegram Receiver for more information. |
| 2 | Configuration for Slack. See Configure Slack Receiver for more information. |
| 3 | Email configuration for out-of-office-hours. See Configure Email Receiver for more information. Configured to only send alerts during out of office hours. |
| 4 | Route configuration. All alerts are routed to the default receiver. See Routing Alerts for more information. |
Configure Pushover Receiver
-
Create a new application on the Pushover console.
-
Set the namespace the alerts are created in, as well as the two Pushover secrets: the user key and the API key.
APP_NAMESPACE=my-namespace PUSHOVER_USER_KEY=xxxxxxxxxxxxxxxxxxxxxxxxxxxxxx PUSHOVER_API_KEY=xxxxxxxxxxxxxxxxxxxxxxxxxxxxxx -
Create secrets for your user key and the API key of your newly created application:
kubectl -n "${APP_NAMESPACE}" apply -f - <<YAML
apiVersion: v1
kind: Secret
metadata:
  name: pushover-user-key
type: Opaque
stringData:
  value: ${PUSHOVER_USER_KEY}
YAML
kubectl -n "${APP_NAMESPACE}" apply -f - <<YAML apiVersion: v1 kind: Secret metadata: name: pushover-api-key type: Opaque stringData: value: ${PUSHOVER_API_KEY} YAML -
Create an
AlertmanagerConfigusing the secrets created above:kubectl -n "${APP_NAMESPACE}" apply -f - <<YAML apiVersion: monitoring.coreos.com/v1beta1 kind: AlertmanagerConfig metadata: name: ${APP_NAMESPACE}-alert-config spec: receivers: - name: pushover pushoverConfigs: - userKey: key: value name: pushover-user-key token: key: value name: pushover-api-key route: receiver: pushover routes: - match: severity: critical continue: true YAML
Configure Telegram Receiver
-
Set the namespace the alerts are created in.
APP_NAMESPACE=my-namespace -
Create a Telegram bot by messaging the @BotFather. See Telegram documentation for more information.
-
Create a secret with the bot token returned by the BotFather.
TOKEN=<TOKEN> (1)
kubectl create secret generic telegram-alert-bot "--from-literal=token=${TOKEN}"
1 Looks like "123456789:ABCDEF1234567890ABCDEF1234567890ABC" -
Find the Chat ID.
Add the bot to a group chat, and send a message to the group chat, or message the bot directly.
Query the Telegram API to get the Chat ID.
curl -X GET "https://api.telegram.org/bot${TOKEN}/getUpdates" | jq '.result[].message | select(. != null)'There should be an object with a
textfield that contains the message you sent. and achat.idfield. Save thechat.idfield for the next step.CHAT_ID=<CHAT_ID> -
Create the AlertmanagerConfig.
kubectl -n "${APP_NAMESPACE}" apply -f - <<YAML
apiVersion: monitoring.coreos.com/v1beta1
kind: AlertmanagerConfig
metadata:
  name: telegram-alert-config
spec:
  receivers:
  - name: default
    telegramConfigs:
    - apiURL: https://api.telegram.org
      botToken: (1)
        key: token
        name: telegram-alert-bot
      chatID: ${CHAT_ID}
      parseMode: HTML (2)
  route:
    groupBy: [alertname, instance]
    receiver: default
YAML
1 The secret created earlier. 2 The default parse mode is MarkdownV2which doesn’t work with the default message template. Telegram wants every special character to be escaped with a backslash. HTML works well with the default Alertmanager template. -
Test the receiver. See Test Alerting.
Configure Slack Receiver
-
Set the namespace the alerts are created in.
APP_NAMESPACE=my-namespace -
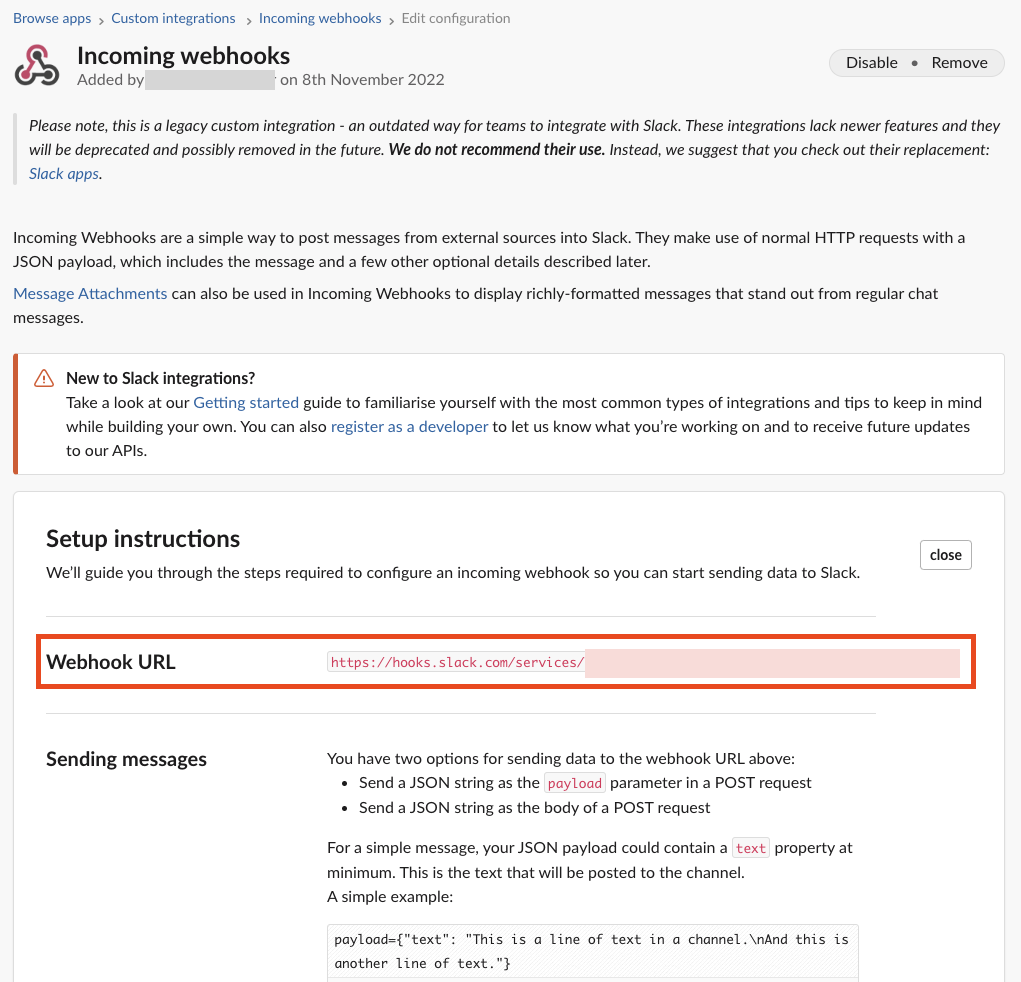
Get the webhook URL from Slack.
Go to my.slack.com/services/new/incoming-webhook/, choose the Workspace in the right upper-most corner, select a channel, and click Add Incoming webhooks integration.
Copy the webhook URL.
-
Create a secret with the webhook URL.
URL=<URL> kubectl create secret generic slack-alert-webhook "--from-literal=url=${URL}" -
Create the AlertmanagerConfig.
kubectl -n "${APP_NAMESPACE}" apply -f - <<YAML
apiVersion: monitoring.coreos.com/v1beta1
kind: AlertmanagerConfig
metadata:
  name: slack-alert-config
spec:
  receivers:
  - name: default
    slackConfigs:
    - apiURL: (1)
        key: url
        name: slack-alert-webhook
      channel: '#alerts' (2)
  route:
    groupBy: [alertname, instance]
    receiver: default
YAML
1 The secret created earlier. 2 The channel to send alerts to. -
Test the receiver. See Test Alerting.
Configure Email Receiver
-
Set the namespace the alerts are created in.
APP_NAMESPACE=my-namespace -
Create a secret with the email authentication password.
PASSWORD=<PASSWORD>
kubectl create secret generic email-alert-auth "--from-literal=password=${PASSWORD}"
This tutorial sets up SMTP authentication using PLAIN authentication. CRAM-MD5 and LOGIN are also supported. See Prometheus documentation for description of the supported authentication fields.
-
Create the AlertmanagerConfig.
kubectl -n "${APP_NAMESPACE}" apply -f - <<YAML
apiVersion: monitoring.coreos.com/v1beta1
kind: AlertmanagerConfig
metadata:
  name: alert-config
spec:
  receivers:
  - name: default
    emailConfigs:
    - to: alerts@example.com (1)
      from: my-app@example.com (2)
      smarthost: smtp.example.com:587 (3)
      authUsername: my-app@example.com (4)
      authIdentity: my-app@example.com (5)
      authPassword: (6)
        key: password
        name: email-alert-auth
  route:
    groupBy: [alertname, instance]
    receiver: default
YAML
1 The email address to send alerts to. 2 The email address to send alerts from. 3 The SMTP server to send alerts through. Alertmanager doesn’t support unencrypted connections to remote SMTP endpoints. 4 The username to authenticate with. If empty, Alertmanager doesn’t authenticate to the SMTP server. 5 The PLAIN identity to authenticate with. Can be the same as the username. Might be omitted for LOGIN protocol. 6 The secret created earlier. -
Test the receiver. See Test Alerting.
Routing Alerts
Alerts can be routed to different receivers based on the labels attached to the alerts.
An AlertmanagerConfig resource defines a routing tree with a root route and child routes.
The root route is the default route and is used for all alerts that don’t match any of the child routes.
The matcher of the root route is set by APPUiO Cloud to match the namespace of the AlertmanagerConfig.
All other matchers are ignored.
route:
  receiver: default
  routes:
  - match: { team: foo }
    continue: true
  - match: { team: bar }
    routes:
    - match: { severity: warning }
    - match: { severity: critical }
The child routes are evaluated in order and the first matching route is used to route the alert.
The match field of a route defines the labels that must match for the route to match.
The match field can be omitted to match all alerts.
Setting continue to true on a route will cause the evaluation to continue to the next route.
This can be used to send alerts to multiple receivers.
It’s possible to mute alerts during certain times of the day.
This can be done by defining a timeInterval and referencing it in the muteTimeIntervals field of a route.
route:
  muteTimeIntervals: [weekends]
timeIntervals:
- name: weekends
  timeIntervals:
  - weekdays: [saturday, sunday]
Alerts can be grouped by labels using the groupBy field.
Grouping sends multiple alerts that are similar together as a single notification.
route:
  groupBy: [alertname]
See Prometheus documentation for more information about routing.
Keys need to be mapped from the Prometheus style (snake case) to the Kubernetes CRD style (camel case).
Some fields might not be supported yet by the AlertmanagerConfig CRD.
Example
This example shows how to route alerts to different receivers based on the labels attached to the alerts.
apiVersion: monitoring.coreos.com/v1beta1
kind: AlertmanagerConfig
metadata:
  name: alert-config
spec:
  receivers:
  - name: default
  - name: database-team-slack
  [ ... ]
  route:
    receiver: default (1)
    routes:
    - match:
        team: database
      continue: false (2)
      receiver: database-team-slack
      routes:
      - match: (3)
          severity: critical
        receiver: database-team-pagerduty
        continue: true (4)
    - match:
        team: backend
      continue: false (2)
      receiver: backend-team-slack
      muteTimeIntervals: (5)
      - non-office-hours
      routes:
      - match:
          severity: critical
        receiver: backend-team-pagerduty
        continue: true
    groupBy: [alertname, instance] (6)
  timeIntervals:
  # Monday to Friday, midnight to 9am and 5pm to midnight (UTC) and weekends
  - name: non-office-hours (7)
    timeIntervals:
    - times:
      - startTime: "00:00" (8)
        endTime: "09:00"
      - startTime: "17:00"
        endTime: "24:00"
      weekdays:
      - "monday:friday"
    - weekdays:
      - "saturday"
- "sunday"| 1 | The default receiver. All alerts that don’t match any team will be routed to this receiver. |
| 2 | Don’t further evaluate the remaining routes.
The alert will be routed to the given team and won’t appear in the default "catch-all" receiver.
false is the default value and only set for demonstration purposes. |
| 3 | Matches alerts with the label team=database, given from the parent route, and severity=critical. |
| 4 | Sets this route as an additional receiver for the alert.
The alert will be routed to the database-team-pagerduty receiver and the parent Slack receiver. |
| 5 | Mutes the Slack alerts for the back-end team during non-office hours.
When a route is muted it won’t send any notifications, but otherwise act normally, this includes ending the route-matching process if the continue option isn’t set. |
| 6 | The labels to group alerts by. Grouping sends multiple alerts that are similar together as a single notification. |
| 7 | Defines a time interval that can be referenced in the muteTimeIntervals field of a route. |
| 8 | All times are in UTC, no other time zones are supported. |
Test Alerting
All changes to alerting routes and receivers should be tested to ensure that receivers are able to correctly receive alerts.
-
Set the namespace you created the
AlertmanagerConfigin.APP_NAMESPACE=my-namespace -
Create a test alert that’s always firing.
kubectl -n "${APP_NAMESPACE}" apply -f - <<YAML
apiVersion: monitoring.coreos.com/v1
kind: PrometheusRule
metadata:
  name: test-alert
spec:
  groups:
  - name: test-alert
    rules:
    - alert: TestAlert
      expr: vector(1)
      for: 10s
      labels: {} (1)
      annotations:
        summary: "Test Alert"
        description: "This is a test alert"
YAML
1 Add labels to the alert to route it to the correct receiver. Usually the default receiver is used if no labels are set. -
Check your configured receivers to see if the alert was received.
See Troubleshooting for debugging tips.
-
Delete the test alert.
kubectl -n "${APP_NAMESPACE}" delete prometheusrule test-alert -
Repeat the test for all receivers by adding the appropriate labels to the alert.
Troubleshooting
OpenShift currently doesn’t expose any logs or status information for Alertmanager. This makes it difficult to debug issues with Alertmanager. The following section describes some common issues and how to debug them.
Check all secret references.
One missing secret reference blocks the creation of all the receivers in the AlertmanagerConfig.
Check the secret values.
Alertmanager may fail to send alerts when the routing configuration has wrong login credentials or missing certificates.
Create a Webhook debug server.
A webhook receiver can be used to debug issues with the routing configuration or to check secret values.
There are webhook debuggers available online, such as webhook.site or requestbin.com.
It’s not recommended to send sensitive information to these services.
This example creates it’s own basic webhook receiver on APPUiO Cloud.
-
Create a Webhook Receiver
APP_NAMESPACE=my-namespace APPS_DOMAIN=apps.ZONE # Replace with your cluster's default app domain from https://portal.appuio.cloud/zones kubectl -n "${APP_NAMESPACE}" create -f - <<YAML apiVersion: v1 kind: ConfigMap metadata: name: logging-webhook data: logging_server.go: | package main import ( "fmt" "io" "net/http" "os" ) func main() { http.HandleFunc("/", func(w http.ResponseWriter, r *http.Request) { defer w.WriteHeader(http.StatusNoContent) defer r.Body.Close() fmt.Println(r.Method, r.URL) r.Header.Write(os.Stdout) fmt.Print("\n") io.Copy(os.Stdout, r.Body) fmt.Print("\n\n") }) panic(http.ListenAndServe(":8080", nil)) } --- apiVersion: apps/v1 kind: Deployment metadata: labels: app: logging-webhook name: logging-webhook spec: replicas: 1 selector: matchLabels: app: logging-webhook strategy: {} template: metadata: creationTimestamp: null labels: app: logging-webhook spec: containers: - image: golang name: golang env: [{ name: 'HOME', value: '/tmp' }] ports: - containerPort: 8080 resources: {} command: [go, run, "/s/logging_server.go"] volumeMounts: - mountPath: /s name: logging-webhook volumes: - configMap: name: logging-webhook name: logging-webhook YAML kubectl -n "${APP_NAMESPACE}" expose deployment logging-webhook kubectl -n "${APP_NAMESPACE}" create ingress logging-webhook "--rule=logging-webhook-${APP_NAMESPACE}.${APPS_DOMAIN}/*=logging-webhook:8080,tls=logging-webhook-tls" kubectl -n "${APP_NAMESPACE}" annotate ingress logging-webhook "cert-manager.io/cluster-issuer=letsencrypt-production" -
Convert or create a
AlertmanagerConfigto use the webhook receiver.kubectl -n "${APP_NAMESPACE}" apply -f - <<YAML apiVersion: monitoring.coreos.com/v1beta1 kind: AlertmanagerConfig metadata: name: debug-alert-config spec: receivers: - name: default webhookConfigs: - url: https://logging-webhook-${APP_NAMESPACE}.${APPS_DOMAIN}/ sendResolved: true httpConfig: authorization: credentials: name: email-alert-auth (1) key: password route: groupBy: [alertname, instance] receiver: default YAML1 Can be used to check if secret values are correctly sent to the webhook receiver. Will show up in the logs as Authorization: Bearer secret value. -
Check the server is up and running.
Getting the TLS certificate may take a few minutes.
curl -v https://logging-webhook-${APP_NAMESPACE}.${APPS_DOMAIN}/ -
Check the logs of the webhook receiver.
kubectl -n "${APP_NAMESPACE}" logs deployment/logging-webhook -fA log message similar to the following should appear:
POST / Authorization: Bearer xxxxxx Content-Length: 1206 Content-Type: application/json Forwarded: for=172.18.200.242;host=logging-webhook-my-namespace.apps.lab-cloudscale-rma-0.appuio.cloud;proto=https User-Agent: Alertmanager/0.24.0 X-Forwarded-For: 172.18.200.242 X-Forwarded-Host: logging-webhook-my-namespace.apps.lab-cloudscale-rma-0.appuio.cloud X-Forwarded-Port: 443 X-Forwarded-Proto: https {"receiver":"my-namespace/debug-alert-config/default","status":"firing","alerts":[{"status":"firing","labels":{"alertname":"EndpointDown","instance":"my-app:8080","job":"probe/my-namespace/my-app-ingress","namespace":"my-namespace","prometheus":"openshift-user-workload-monitoring/user-workload","severity":"critical"},"annotations":{"summary":"Endpoint my-app:8080 down"},"startsAt":"2022-11-09T13:41:43.399Z","endsAt":"0001-01-01T00:00:00Z","generatorURL":"https://thanos-querier-openshift-monitoring.apps.lab-cloudscale-rma-0.appuio.cloud/api/graph?g0.expr=probe_success%7Bnamespace%3D%22my-namespace%22%7D+%3D%3D+0\u0026g0.tab=1","fingerprint":"972537dc10d0155f"}],"groupLabels":{"alertname":"EndpointDown","instance":"my-app:8080"},"commonLabels":{"alertname":"EndpointDown","instance":"my-app:8080","job":"probe/my-namespace/my-app-ingress","namespace":"my-namespace","prometheus":"openshift-user-workload-monitoring/user-workload","severity":"critical"},"commonAnnotations":{"summary":"Endpoint my-app:8080 down"},"externalURL":"https:///console.lab-cloudscale-rma-0.appuio.cloud/monitoring","version":"4","groupKey":"{}/{namespace=\"my-namespace\"}:{alertname=\"EndpointDown\", instance=\"my-app:8080\"}","truncatedAlerts":0} -
Delete the manifests.
kubectl -n "${APP_NAMESPACE}" delete alertmanagerconfig debug-alert-config
kubectl -n "${APP_NAMESPACE}" delete ingress logging-webhook
kubectl -n "${APP_NAMESPACE}" delete service logging-webhook
kubectl -n "${APP_NAMESPACE}" delete deployment logging-webhook
kubectl -n "${APP_NAMESPACE}" delete configmap logging-webhook
kubectl -n "${APP_NAMESPACE}" delete secret logging-webhook-tls