Monitor HTTP(S) Endpoints Using Blackbox Exporter
|
To get notified about firing alerts you need to setup an alert receiver. See Configure Alert Receivers for more information. |
Prerequisites
-
Command Line Access to APPUiO Cloud
-
Helm 3, helm.sh
Install Blackbox Exporter
-
Set the namespace for the Blackbox Exporter
APP_NAMESPACE="my-app" (1)
EXPORTER_NAMESPACE="${APP_NAMESPACE}" (2)
1 The namespace of your application. 2 The Exporter can be installed in the same namespace as your application or in a separate namespace. If you deploy the Blackbox Exporter in a separate namespace and want to use in-cluster probes, you’ll have to configure additional network policies as the default network policies configured by APPUiO Cloud isolate namespaces from each other. See the Tips & Tricks section for more information. -
Check if signed in
kubectl get projects -
Install the Blackbox Exporter
# Add the prometheus-community Helm repository
helm repo add prometheus-community https://prometheus-community.github.io/helm-charts
helm repo update

# Install the Blackbox Exporter
helm install blackbox-exporter prometheus-community/prometheus-blackbox-exporter \
  --namespace "${EXPORTER_NAMESPACE}" \
  --set pspEnabled=false \
  --set securityContext.runAsUser=null,securityContext.runAsGroup=null
Configure a Blackbox Exporter Probe
-
Configure a probe
kubectl -n "${APP_NAMESPACE}" apply -f - <<YAML
apiVersion: monitoring.coreos.com/v1
kind: Probe
metadata:
  name: my-app
spec:
  prober:
    url: blackbox-exporter-prometheus-blackbox-exporter.${EXPORTER_NAMESPACE}.svc.cluster.local:9115 (1)
  targets:
    staticConfig:
      static:
      - my-app.${APP_NAMESPACE}.svc:8080 (2)
      - https://my-app.apps.appuio-cluster.cloud (3)
YAML
1 The URL of the Blackbox Exporter may be different if you’re using different Helm values or a different release name. Check with kubectl get svc -n ${EXPORTER_NAMESPACE}.2 You can configure a cluster-local probe by providing the name and port of the application’s in-cluster service. The suffix .${APP_NAMESPACE}.svccan be omitted if you’ve installed the Blackbox Exporter in the same namespace as your application.3 You can configure a probe to the public address of your application. This is only relevant if you’re setting up a probe for an application which is exposed through an IngressorRoute. You may want to explicitly probe both thehttps://andhttp://URLs to test the HTTPS redirect.APPUiO Cloud currently doesn’t support configuring probes with Ingress discovery ( .spec.targets.ingress). -
Verify the configuration
Navigate to the OpenShift Web Console console.CLUSTER.cloud/dev-monitoring/ns/<APP_NAMESPACE>/metrics.
Select Custom Query and enter
up{job=~"probe/.*"}. There should be an entry for each target with a value of1if the probe was successful.
If the probe doesn’t show up in the list or the value is
0see the Troubleshooting section. -
Verify the probe
Select Custom Query and enter
probe_success. There should be an entry for each target with a value of1if the probe was successful.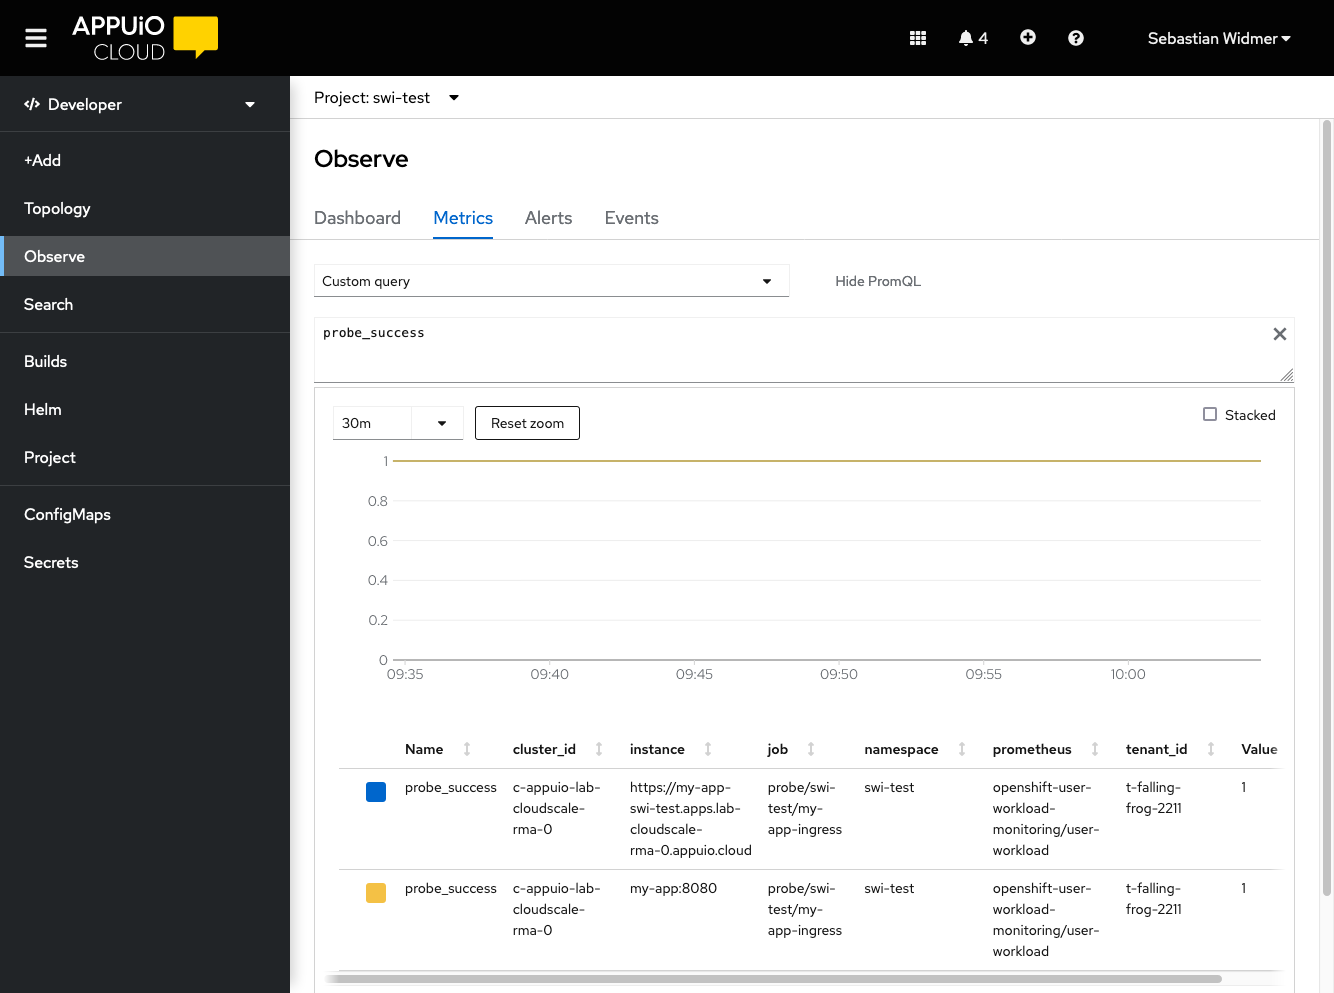
If the probe doesn’t show up in the list or the value is
0see the Troubleshooting section.
Create an Alert for the Probe
-
Create the alert
kubectl -n "${APP_NAMESPACE}" apply -f - <<YAML
apiVersion: monitoring.coreos.com/v1
kind: PrometheusRule
metadata:
  name: my-app-blackbox-alerts
spec:
  groups:
  - name: my-app-blackbox.rules
    rules:
    - alert: EndpointDown
      expr: probe_success == 0 (1)
      for: 5m (2)
      labels:
        severity: critical
      annotations:
        summary: "Endpoint {{ \$labels.instance }} down"
YAML
1 The probe_successmetric is created by the Blackbox Exporter as an overall status of the probe. You can also alert on the individual metrics likeprobe_http_status_codeorprobe_duration_seconds. Query all available metrics with{job=~"probe/.*"}.2 The forclause specifies how long the probe has to fail before the alert is triggered. Using a low value here will trigger the alert quicker, but may generate false positives. -
Verify that the alert was picked up by Prometheus
Navigate to the OpenShift Web Console console.<CLUSTER>.cloud/dev-monitoring/ns/<APP_NAMESPACE>/alerts.
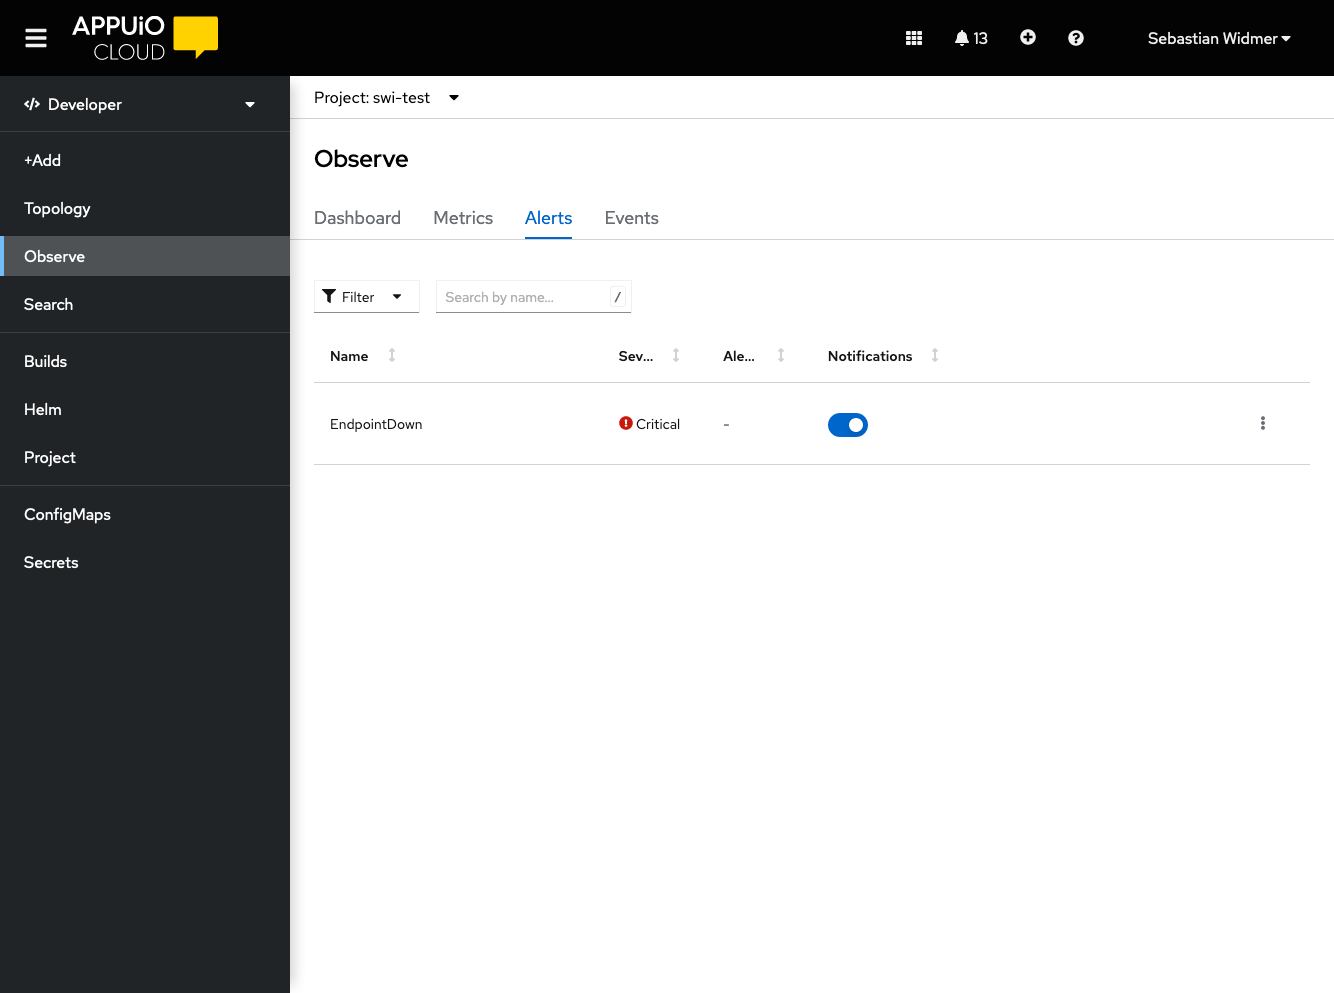
The alert should be displayed in the list of alerts.
It may take a few minutes for the alert to show up. If the alert doesn’t appear after a few minutes, see the Troubleshooting section.
Troubleshooting
No Entry is Shown in the List if Querying the up Metric up{job=~"probe/.*"}
The probe CRD isn’t well-formed or Prometheus hasn’t yet scraped the probe.
Prometheus hasn’t yet scraped the probe. Wait for three more minutes and check again.
If no entry is shown in the list, the Probe CRD most likely is misconfigured.
Especially check the spec.prober.url.
The format is HOST:PORT.
HOST isn’t valid.
The Value of the up Metric is 0
The probe CRD is well-formed but the Blackbox Exporter isn’t reachable.
If the value is 0, the Probe CRD is valid, but the Blackbox Exporter can’t be reached.
Double check the .spec.prober.url of the Probe CRD.
Check if the Blackbox Exporter deployment is running and ready.
probe_success shows 0
The probe CRD is well-formed and the Blackbox Exporter is reachable. The target isn’t reachable, the certificate is bad, or the target returns an unwanted status code.
Check the probe_http_status_code for the job.
Only 2XX is considered a success after the final redirect.
If the status code is 0, the problem is earlier in the chain.
No Alerts Shows Up in the Alert List
The PrometheusRule CRD might not be well-formed and might have failed to apply.
-
Check if the
PrometheusRuleCRD was created successfully.kubectl -n "${APP_NAMESPACE}" get prometheusrules
Debug Failing Probes
-
Connect to the Blackbox Exporter
kubectl --namespace "${EXPORTER_NAMESPACE}" port-forward svc/blackbox-exporter-prometheus-blackbox-exporter 9115 -
Open the Blackbox Exporter in a browser
Navigate to localhost:9115.
-
Choose the failed target from the list
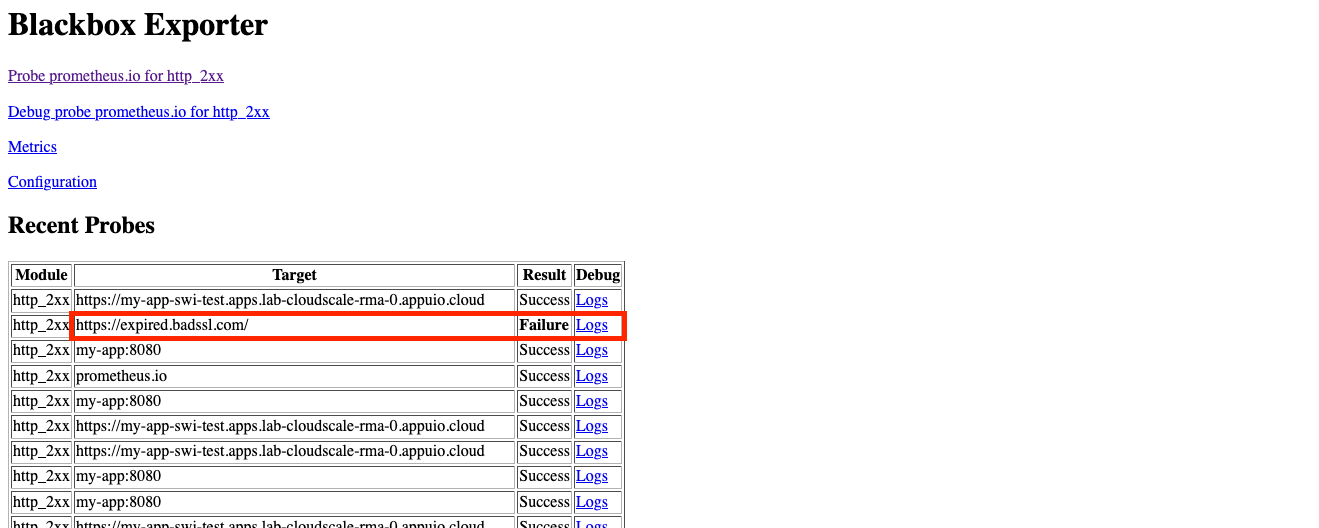
Click logs on the failed target.
-
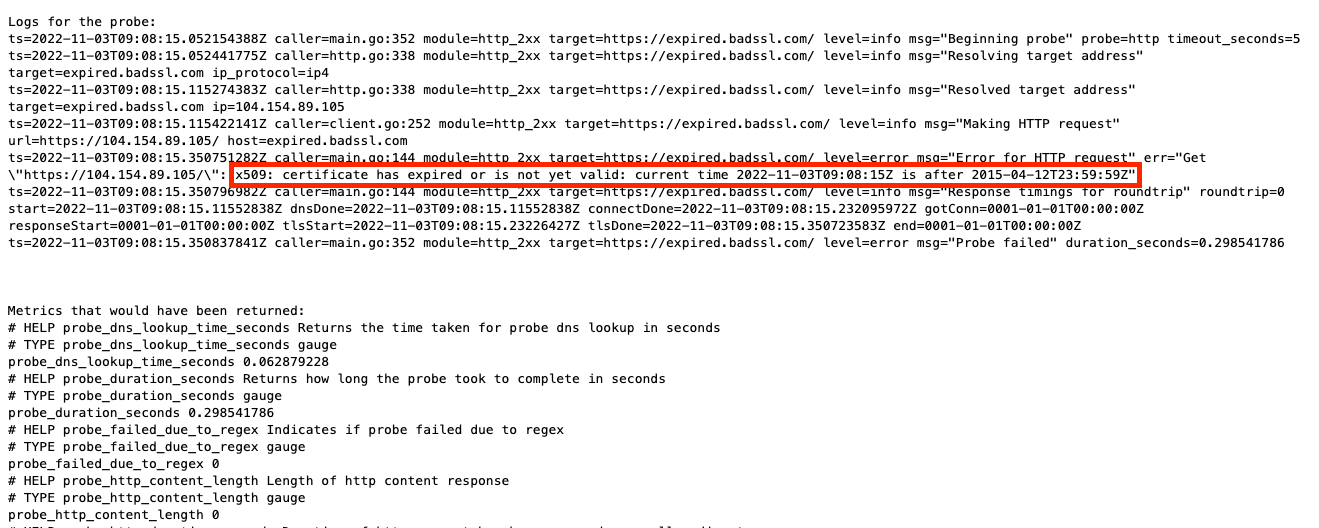
Check the logs
The logs should show the reason for the failure. In this example an expired certificate is the cause of the error.
Tips & Tricks
Public (Ingress) vs. Local Probes
Local probes have a higher chance of just monitoring the application. They don’t have to go through the ingress so you won’t be notified if there are problems with the ingress. However, it isn’t possible to detect expired certificates or misconfigured ingresses.
Public probes have a higher chance of detecting false positives. For example, a public probe will fail if the application works, but the ingress is down. However, they allow you to setup alerts for expiring certificates configured on the application’s ingress and misconfigurations of the ingress itself.
Cross Cluster Probes
The Blackbox Exporter can be installed on a different zone or cluster than the application and probe the public endpoint of the application.
| There is a big unknown (the internet) in between clusters. There is a high chance that the probe will fail because of unrelated network issues between the two clusters. |
Install Blackbox Exporter in a Different Namespace
The Blackbox Exporter can be installed in a different namespace than the application. This can be useful if you want to monitor multiple applications with only one Blackbox Exporter.
APPUiO Cloud isolates namespaces from each other by default.
Blackbox Exporter probes can be allowed by configuring a NetworkPolicy in the namespace of the application.
apiVersion: networking.k8s.io/v1
kind: NetworkPolicy
metadata:
  name: blackbox-exporter-ingress
spec:
  podSelector: {} (1)
  policyTypes:
    - Ingress
  ingress:
    - from:
        - namespaceSelector:
            matchLabels:
              kubernetes.io/metadata.name: ${EXPORTER_NAMESPACE} (2)
      ports: (3)
        - protocol: TCP
          port: 443
        - protocol: TCP
port: 80| 1 | Allow all pods in the namespace to be probed. Can be restricted to a specific label selector. |
| 2 | The name of the namespace where the Blackbox Exporter is installed. |
| 3 | Allow probes on port 80 and 443. If left out, all ports are allowed. |
See the Kubernetes documentation for more information about NetworkPolices.
TLS Checks
The Blackbox Exporter returns metrics for the TLS certificate validity period.
Using this information, you can alert on expired certificates by checking the probe_ssl_earliest_cert_expiry metric.
apiVersion: monitoring.coreos.com/v1
kind: PrometheusRule
metadata:
  name: my-app-blackbox-alerts
spec:
  groups:
  - name: my-app-blackbox.rules
    rules:
    - alert: TLSCertExpiringSoon
      expr: probe_ssl_earliest_cert_expiry - time() < 5 * 86400 (1)
      for: 1m
      labels:
        severity: warning
      annotations:
        description: "TLS certificate for {{ $labels.instance }} will expire in {{ $value | humanizeDuration }}"
    - alert: EndpointDown
      expr: probe_success == 0
      for: 5m
      labels:
        severity: critical
      annotations:
summary: "Endpoint {{ $labels.instance }} down"| 1 | The probe_ssl_earliest_cert_expiry metric is the earliest expiration date of the certificate chain.
5 days are chosen to give enough time to renew the certificate even through extended weekends. |
| If you’re using Let’s Encrypt certificates, you may want to alert for certificates expiring in 20 days or less, as the default configuration for APPUiO Cloud renews Let’s Encrypt certificates when their remaining validity is 30 days. |